Dataset alignment represented as tensor networks
February 10, 2018
I want to know how a someone’s education level correlates with their income. But I don’t have that dataset. I have datasets relating income to people and people to their eduction, it should be a simple job to align these datasets to find what I am looking for. And it is, if you are familiar with matrix operations, some light coding, …
The problem is siloed (aka distributed aka federated) data. For whatever reason, data exists as independent sets. This may be due to a few reasons;
- the data is noisy and therefore aligning them takes effort,
- aligning the datasets would start to erode privacy,
- govt agencies don’t talk (need MoUs etc etc),
but fundamentally, it comes down to the fact that data collection is often distributed and asynchronous. So they must be aligned at some point.
Datasets
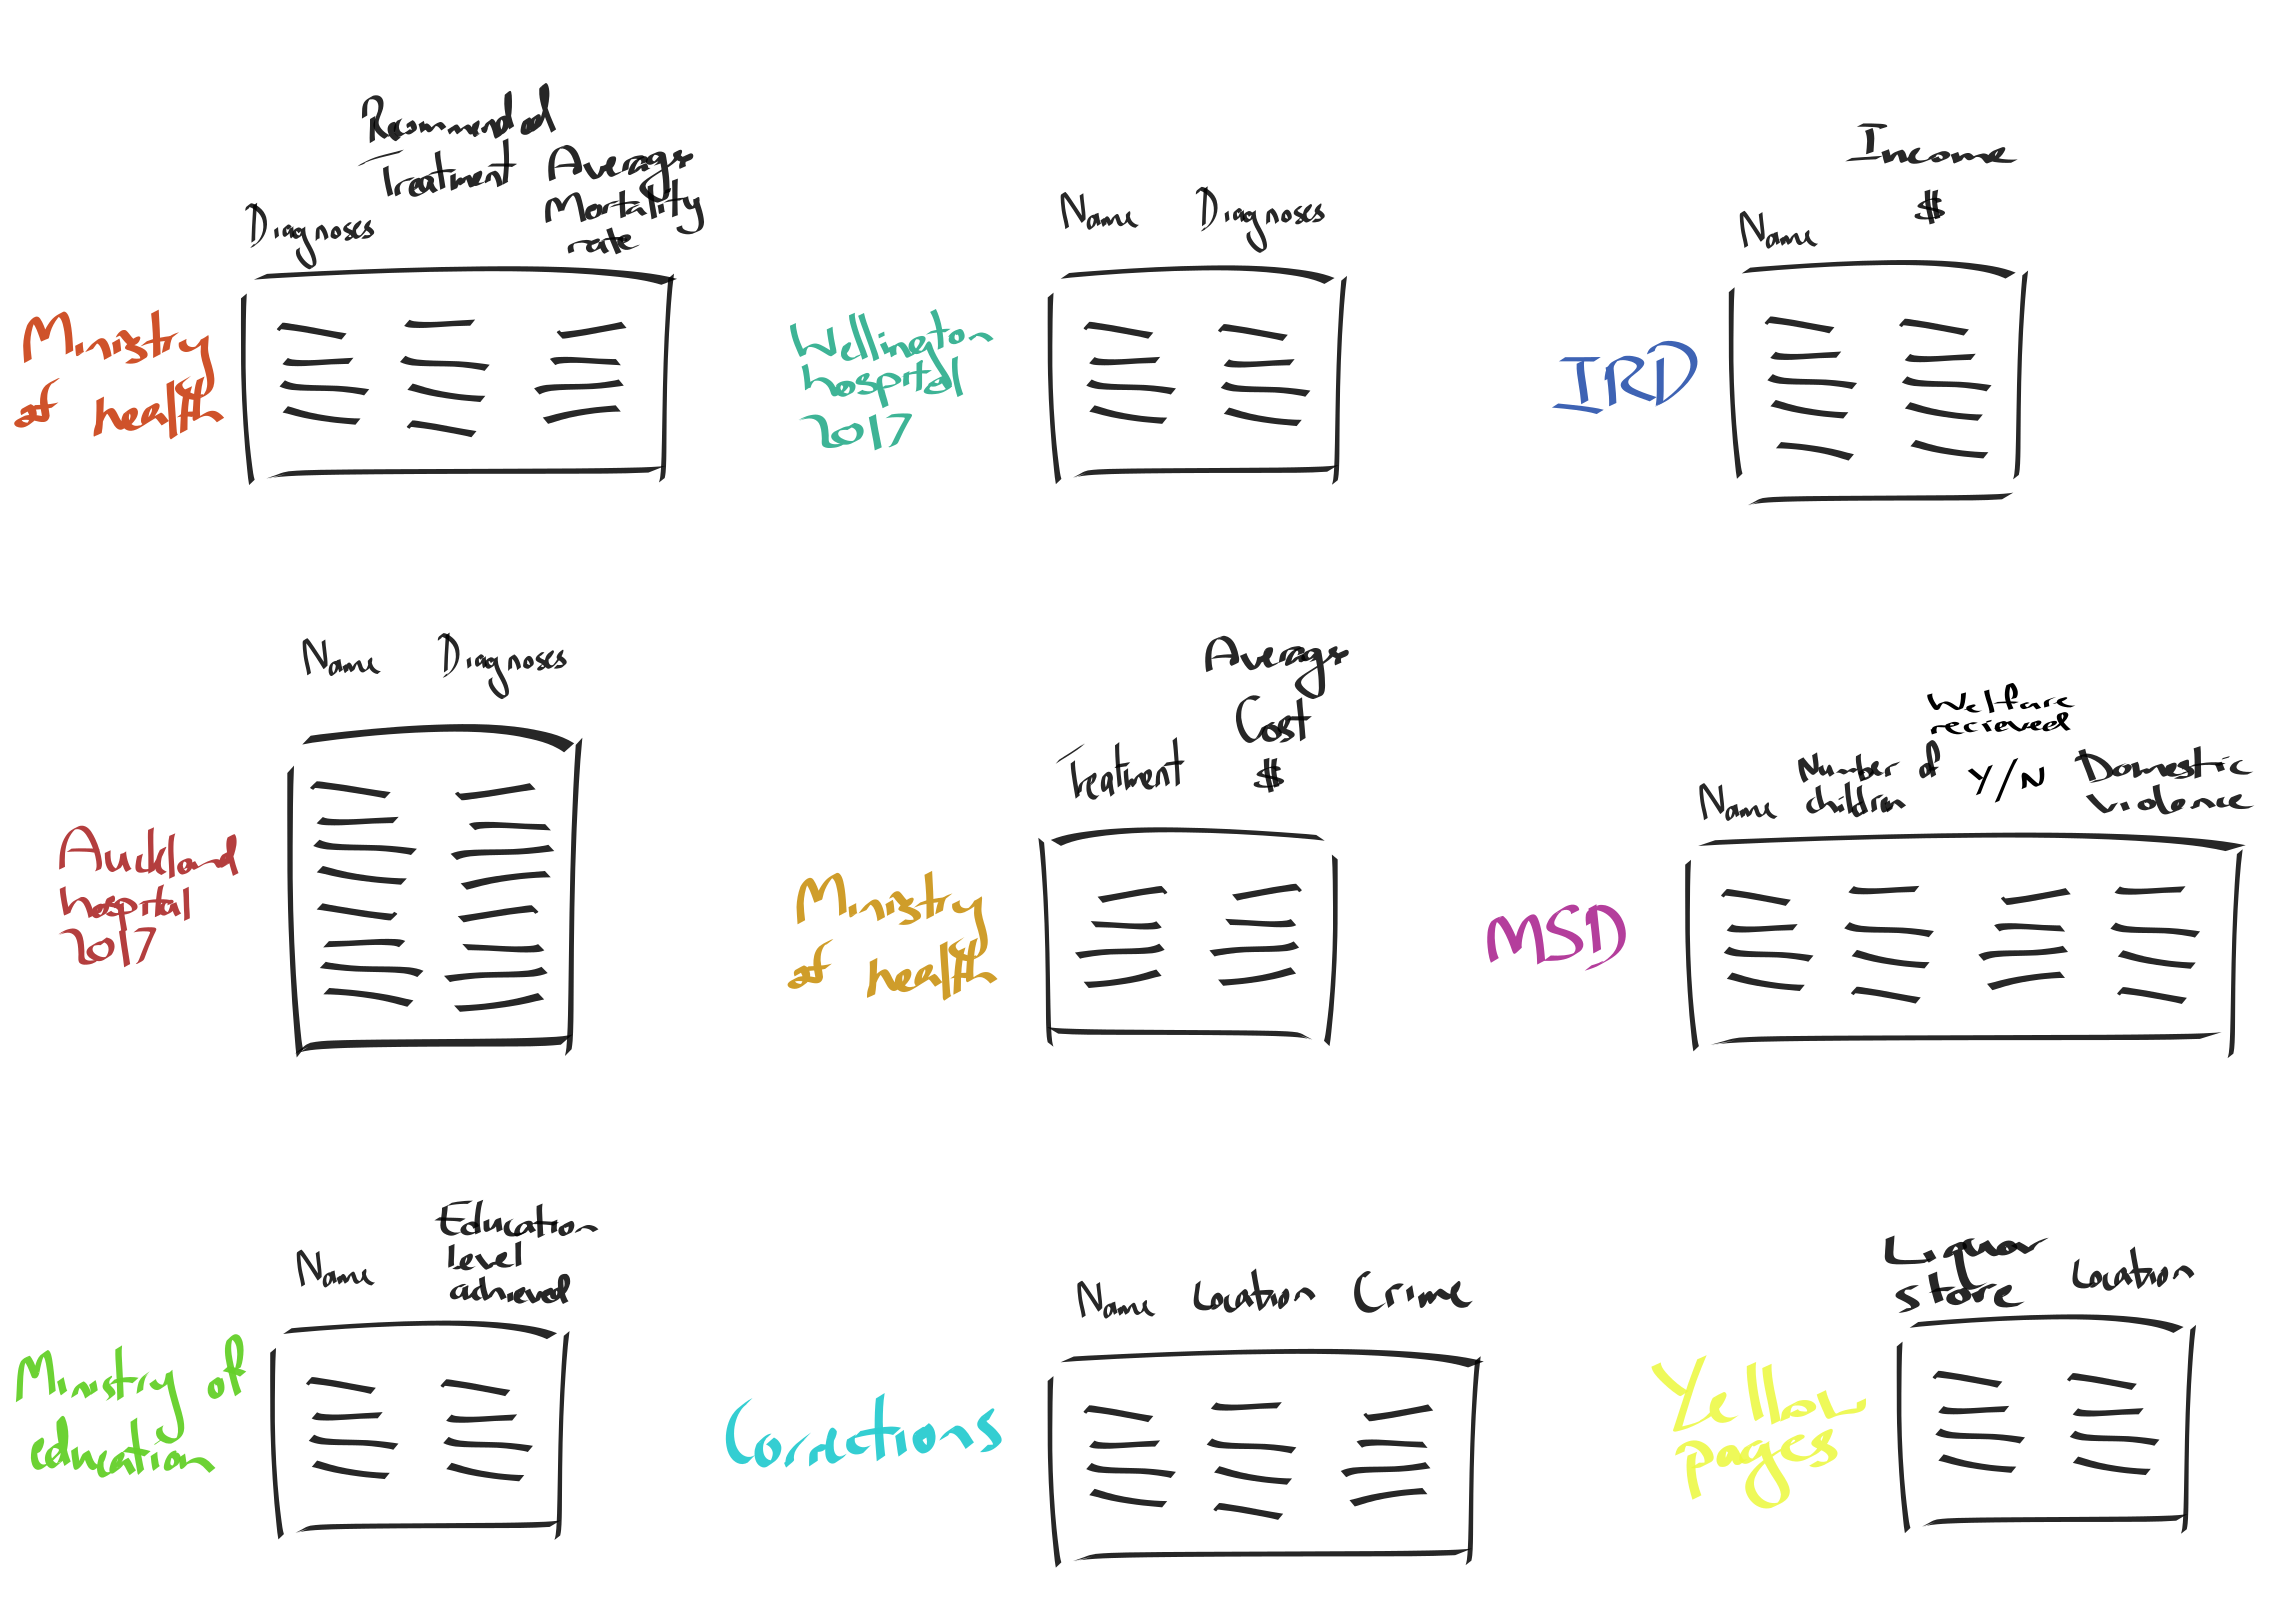
Lets start with an example. Take the image below, various govt departments have datasets, and what we would really like is the ability to correlate diagnoses with other socio-economic factors. This could allow us to learn a predictive model to identify people at risk. But instead, all we have is the recommend treatment and average mortality rates, see the orange dataset (top left).
Data alignment
What does it mean to align a dataset?
The two hospital datasets can vertically stacked. This means that we can stack the two names columns ontop of each other thus giving us a names x diagnoses dataset for Auckland and Wellington. However, a common problem is that someone might have visited both hospitals, thus we need to check all entities for duplicates and resolve them.
In contrast, take the IRD (name x income) and ministry of education datasets (name x education level). We can stack these two datasets horizontally. This means we can construct a name x income x education level dataset. This requires are to align the two datasets by name and then add two columns, one for income and one for education.
The most useful part about horizontal alignment is that we can now correlate income and education by marginalising out the names (summing over them). We can construct a income x education level dataset!
A graphical representation
What is really going on when we vertically or horizontally stack? Are there easier ways to visualise it?
If we draw every distinct column within our many datasets (above) as a node, and then construct edges by using the dataset linking two nodes, we get the picture below.
So vertical staking becomes multiple links between two nodes, see name x diagnoses. And horizontal stack becomes a new linkage between the original datasets.
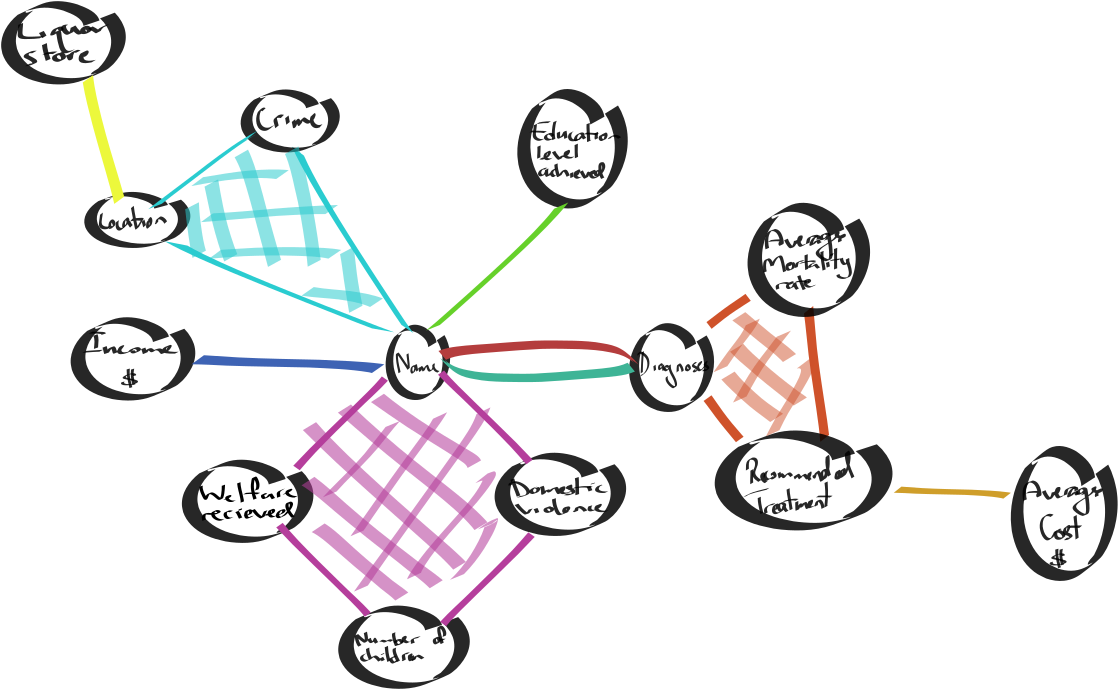
Note the location node. While I was at NEC we were exploring using location to help us align different datasets, but this framework is far more general, allowing you to align datasets across any shared dimension.
Tensor networks
For the mathematically inclined, each column adds a dimension to a nd-tensor. The topology of the graph above represents the dual (the transpose hypergraph, see this paper for more details) of the topology of a tensor network below.
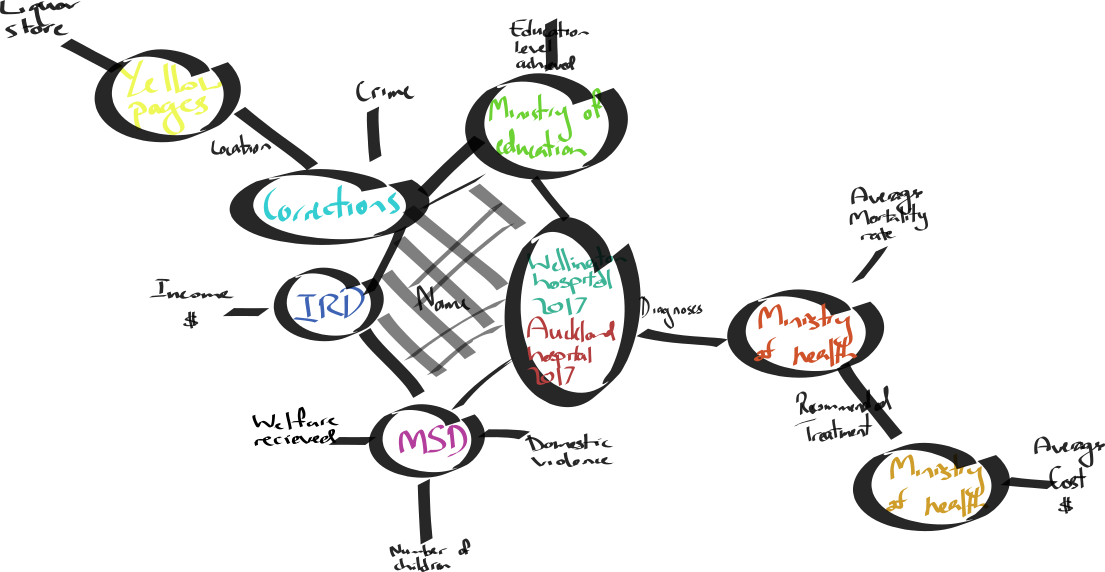
This network more clearly shows the relationship between the datasets, at each node, and the graph constructed. But I prefer the former as it seems for reasons to come.
Traversing to find correlations
The coolest part is that, once constructed, we can traverse this graph to correlate two nodes. If two nodes are connected, then, through the edges, we can propagate correlations. Thus, using the example above, we can ask for;
Income x Education levelorWelfare received x average cost of treatment- and so on.
This seems like an easy interface to use. Drawing lines on gaphs to return their relationship.
Open questions;
- what does it means to traverse via one path rather than another?
- what is the right way to marginalise over all paths?
- how can these tensors be efficiently stored?